 Abra
AbraAn invite-only Pine
for your TradingView charts.
AbraTrades V1 is a public invite-only TradingView Pine powered by 30+ specialized agents that turns market confluence into clear visual data through colors and lines. The idea behind this tool is to make learning market structure, trend analysis, liquidity concepts, and overall chart study easier and more accessible for traders at every experience level. From seasoned traders to complete newcomers, AbraTrades V1 is designed to make chart study easier to understand through visual learning and theoretical signaling.
Educational-use notice: AbraTrades includes theoretical signaling that represents a confluence of indicators. It does not execute trades or predict outcomes; you remain responsible for every trading decision.
What should you study next on your chart?
Choose the answer closest to where you are. This is an educational prompt, not a trade recommendation.
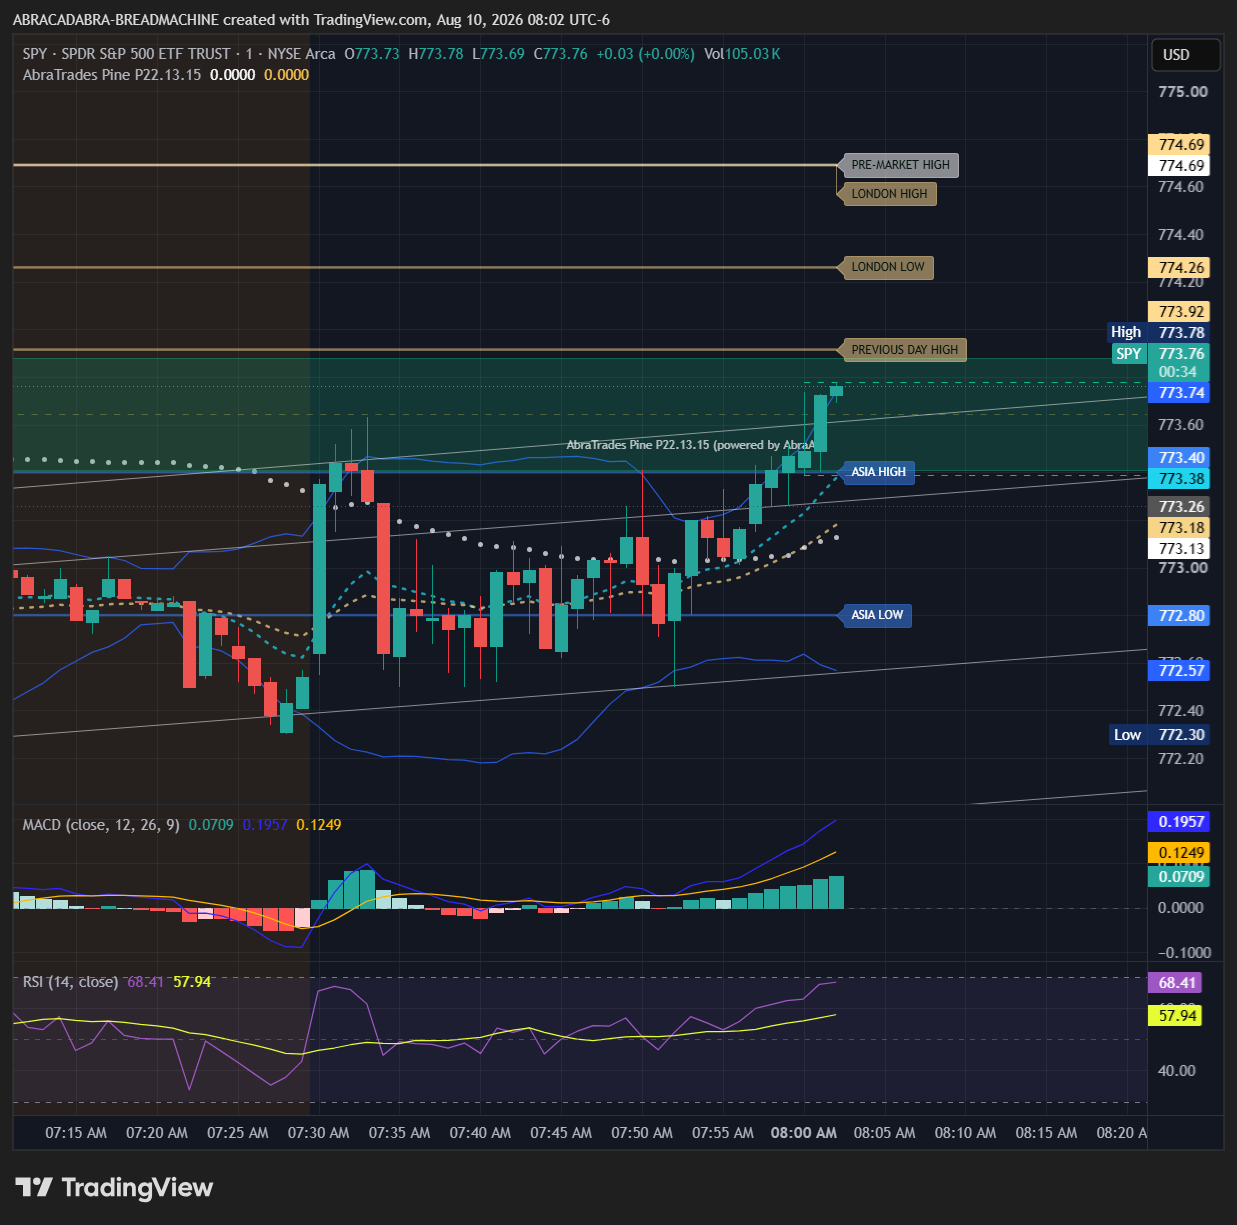
A visual TradingView decision-support indicator.
AbraTrades V1 adds configurable chart context to your own TradingView charts. It does not place trades, connect to a broker, or make decisions for you.
Use its layers to study market structure, sessions, levels, momentum, and confluence before making your own independent decision.
Study the chart. Test an idea. Learn with the community.
Start with a free 14-day trial, use the indicator on your own TradingView chart or in Bar Replay, then continue learning through the free chart-context checklist, YouTube walkthroughs, and the Abracadabra Freedom community.
30+ agents, one invite-only Pine experience
AbraTrades V1 brings a council of 30+ specialized agents together around market structure, momentum, levels, and confluence. Their work is visualized in an invite-only Pine indicator on your TradingView charts.
V1 is built for visual decision support: you see the same chart context, levels, and theoretical signals in one place.
AbraTrades V1, live on TradingView
The agents build context
30+ agents assess chart structure, momentum, levels, and market confluence.
V1 presents the setup
The Pine organizes that context into visual levels and theoretical signals for chart study.
You use it on TradingView
Approved users receive access to the public invite-only V1 indicator on their own charts.
Independent chart-analysis roles, organized into one visual view.
In AbraTrades V1, “agents” describes specialized analysis roles and rule sets that observe different types of chart context. They are not autonomous traders, individual investment advisers, or a promise of a trade outcome.
The Blackboard is the shared context layer: it combines the available observations and presents their overlap as configurable visual information on the chart. It is decision support, not a prediction engine or automated execution service.
Chart-context categories available for study.
AbraTrades uses more than 30 specialized trading-agent roles across the categories below. Multiple roles can contribute to a category; these are the chart-analysis groups users can explore, not one-to-one labels for individual agents. Their presence does not make a setup certain or suitable for every market, timeframe, or trader.
Market structure
Price swings, structural reference areas, and evolving context.
Momentum
Momentum indicators and changes in directional participation.
Liquidity
Session and chart areas where liquidity may be relevant for study.
Fibonacci
Fibonacci-derived reference levels displayed as additional context.
Sessions
Pre-market, Asia, London, and other session-based reference levels.
Volume
Volume and participation context when available on the underlying chart.
Support & resistance
Potential reference areas derived from price behavior and levels.
Trend context
Trend and moving-average context for comparing current price behavior.
Confluence
Overlapping conditions highlighted for independent review, not trade instruction.
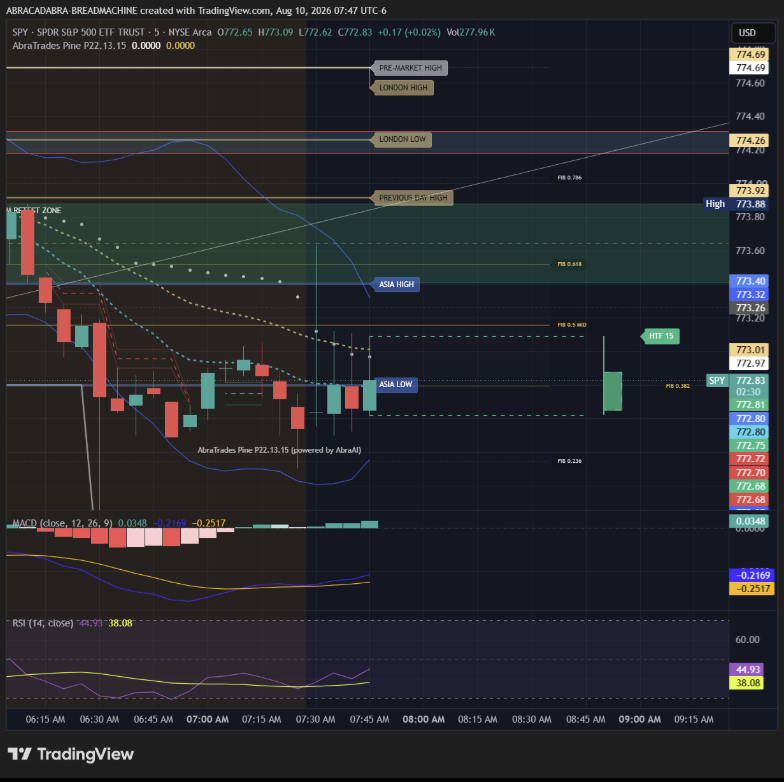
SPY near 772.8, consolidating after the early decline.
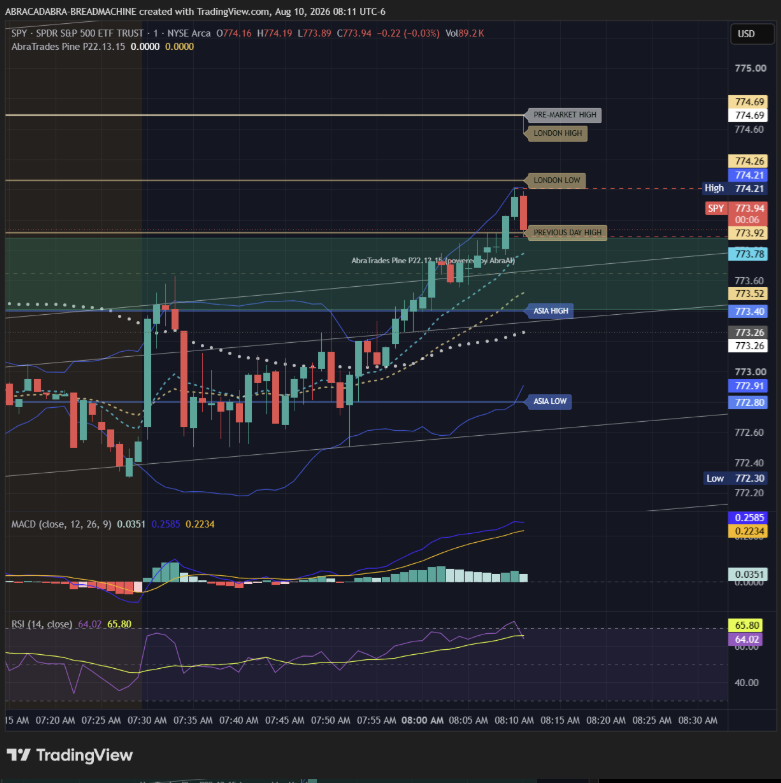
Learn day-trading skills on the chart.
AbraTrades is an educational system built to help you learn the skills and strategies behind day trading. It brings structure, momentum, key levels, and confluence together on one chart so you can study how each element relates to price action.
Its 30+ specialized agents weigh their individual strategies against one another through a blackboard consensus, then present theoretical signals and chart context for you to examine. Use the same invite-only V1 Pine on any TradingView-supported asset — stocks, crypto, ETFs, futures, options, and more.
In this SPY example, the indicator highlights where resting liquidity levels may be. The green box marks the 8 AM (ET) retest zone — one of the many agents built into AbraTrades. Fibonacci levels are superimposed to add another layer of chart context. You can turn individual layers on or off to explore different strategies, or keep them all visible at once to study the full AbraTrades confluence.
Educational use only: theoretical signals are not trading advice, are not recommendations to buy or sell, and do not guarantee profits or performance.
Follow another trading day as the context changes.
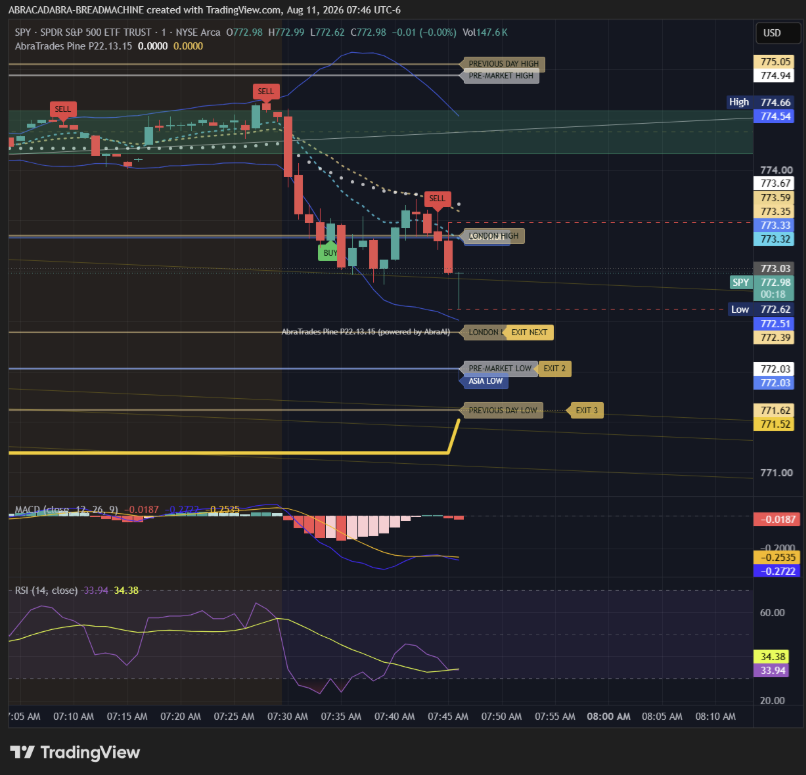
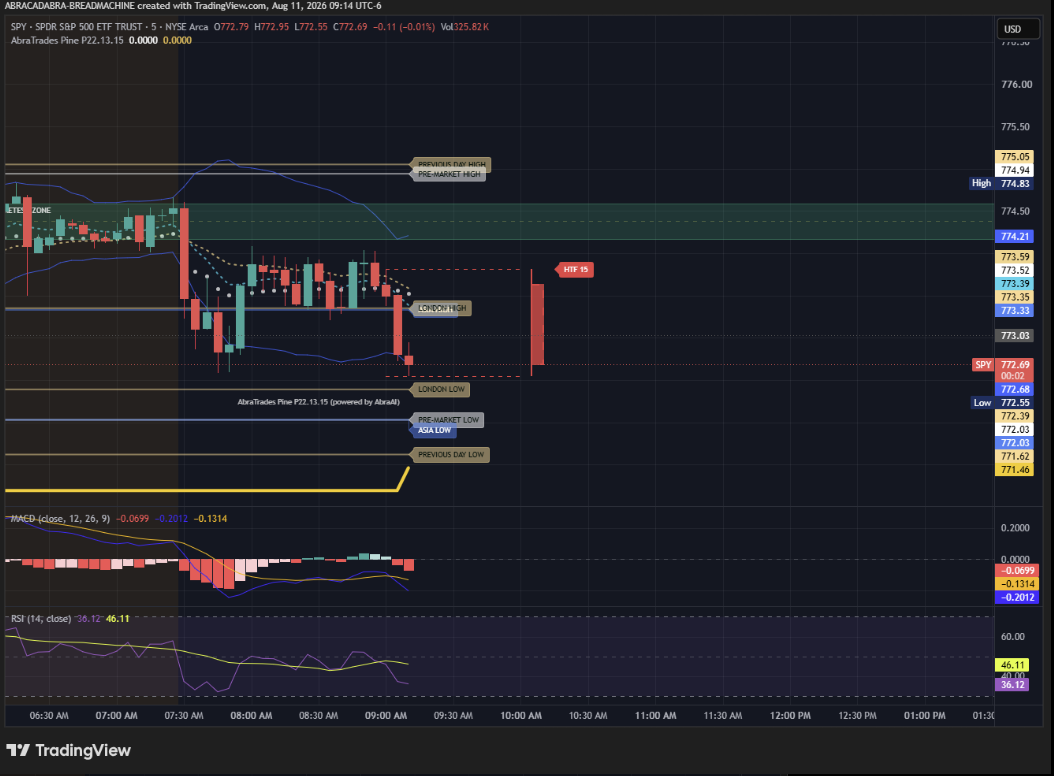
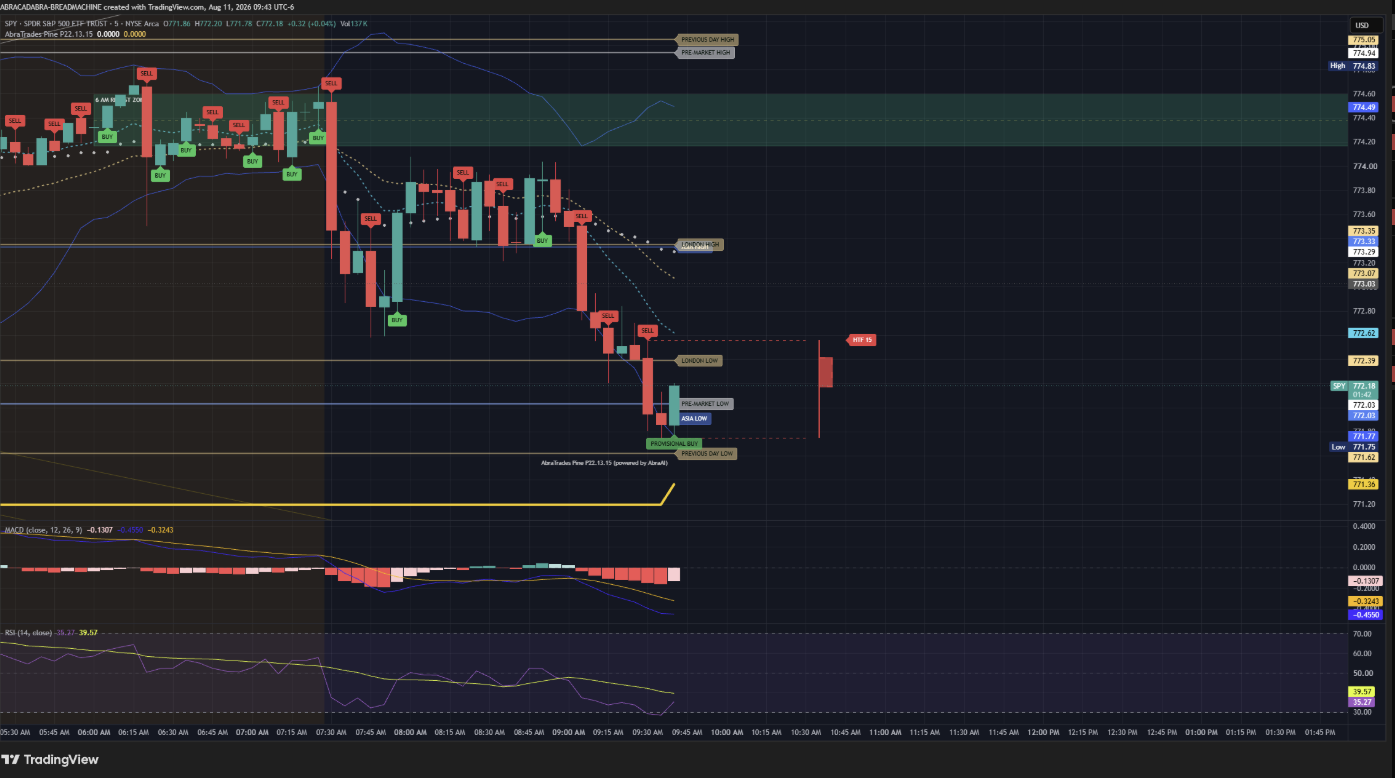
Four chart captures from Aug. 11, 2026, shown in the order they appeared. Click the chart or let it play through automatically.
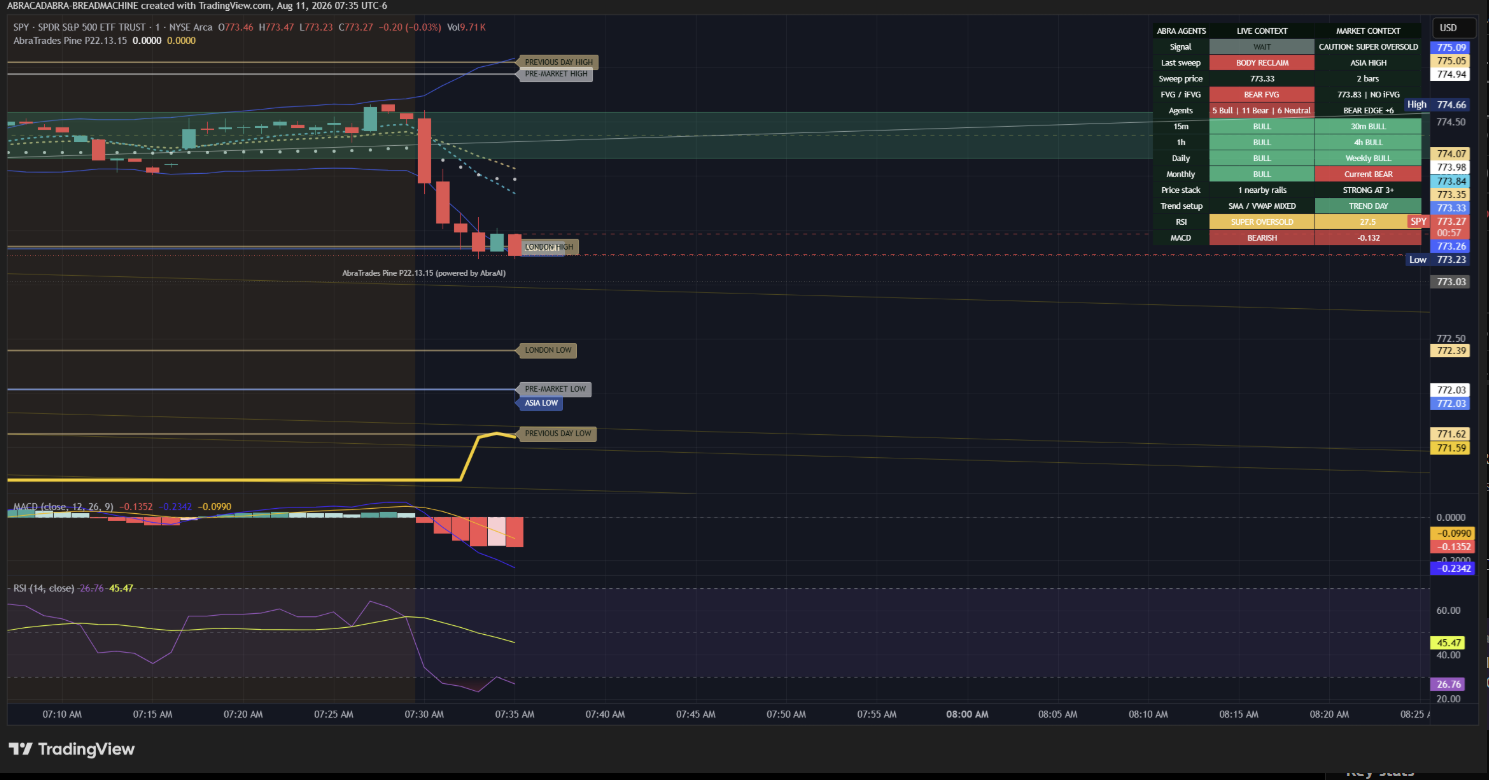
Price had moved down from the upper area and was trading near 773.3.
One chart, evolving context.
This example moves from 07:35 to 09:43 UTC−6. The chart first shows an opening move away from the upper reference area, then continued movement toward lower session levels. Later frames bring the London Low, pre-market low, Asia Low, and previous-day-low areas into view.
The purpose is to review how levels, momentum tools, theoretical signals, and agent context can change during a session — not to predict an outcome. Use the carousel to compare each moment and develop your own chart-reading process.
Educational use only: this case study is not trading advice, a recommendation to buy or sell, or a guarantee of results.
Multiple strategies. One unified chart-study tool.
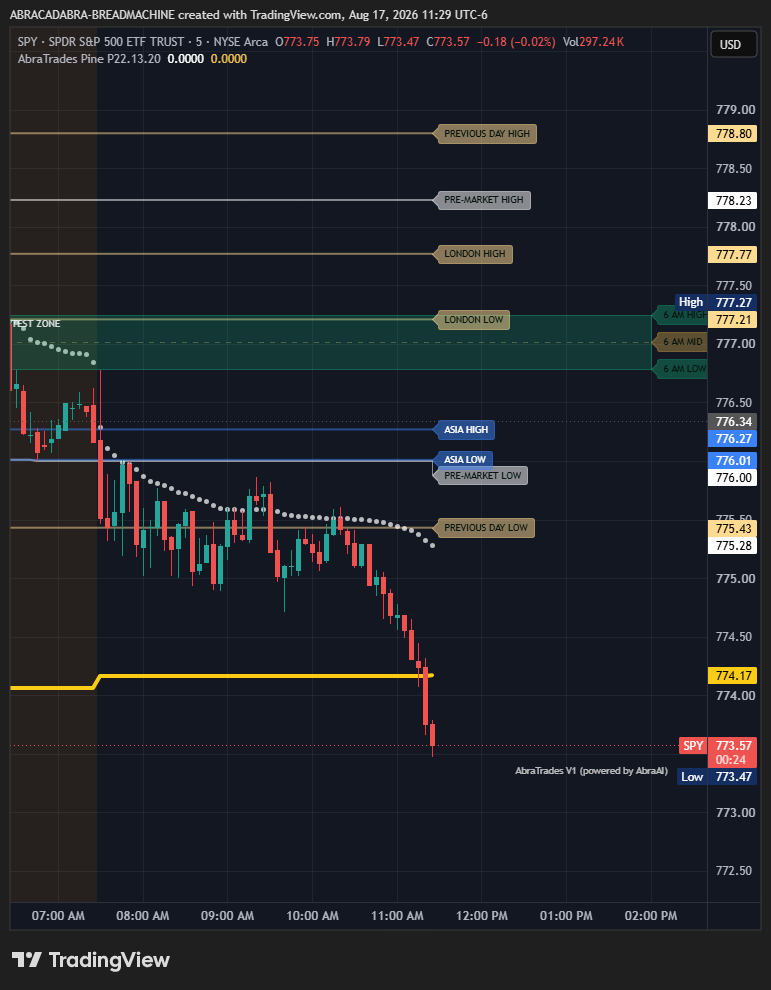
Seven timestamped SPY captures from August 17, 2026 show how the 8 AM retest, VWAP, liquidity and session levels, market structure, theory signals, and the 5-day SMA can be studied together in one workflow. Presented in the supplied seven-image progression, from 7:34 AM to 11:29 AM (UTC−6).
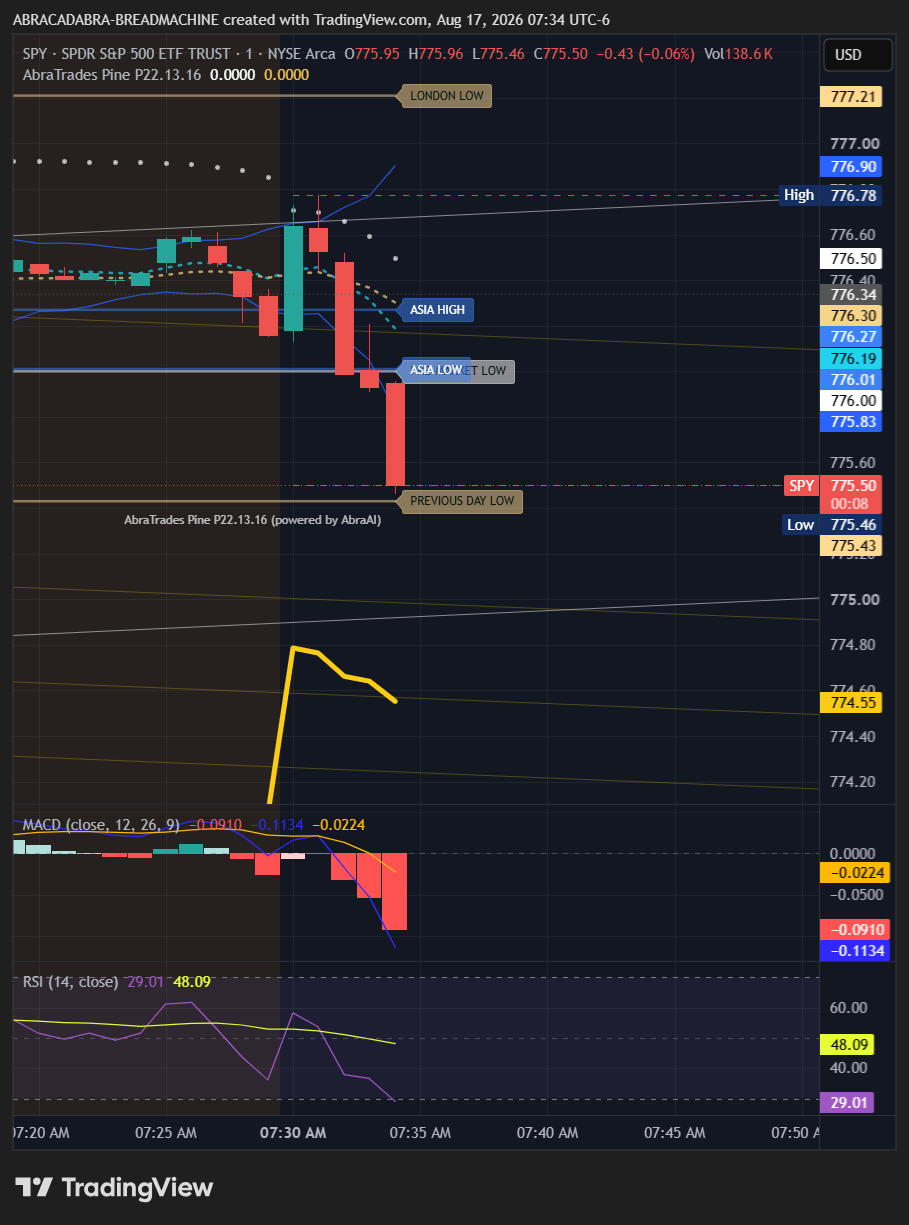
The chart begins with session levels, the yellow 5-day SMA, and developing bearish structure visible together.
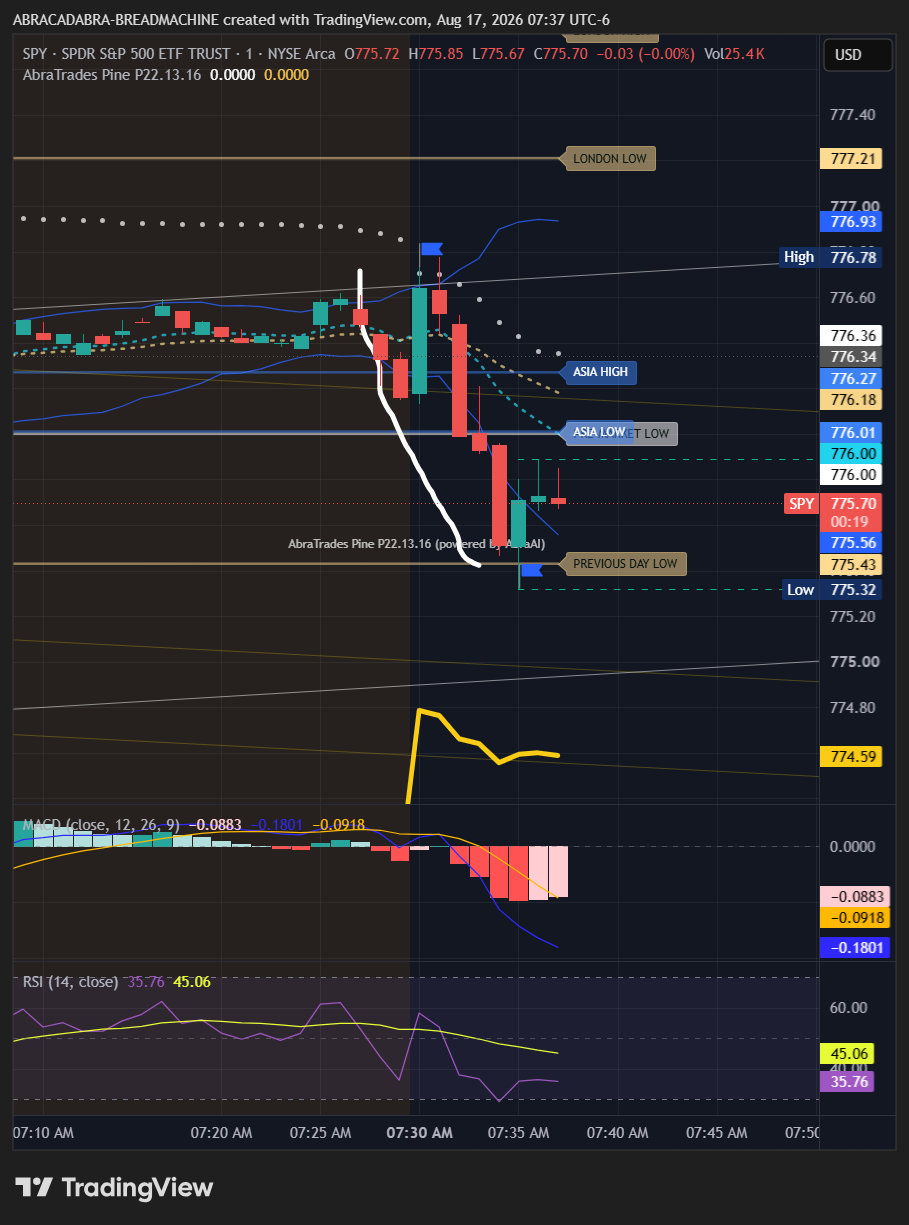
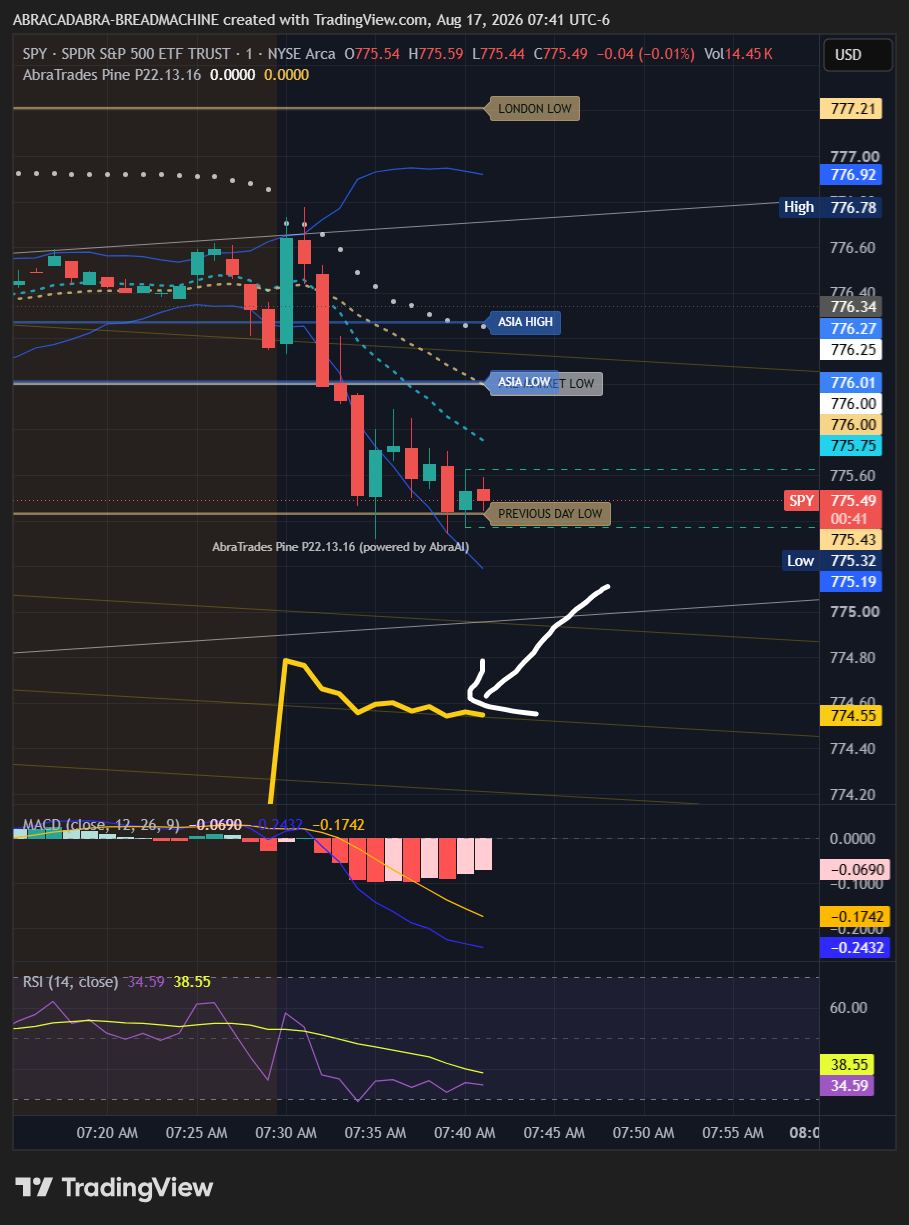
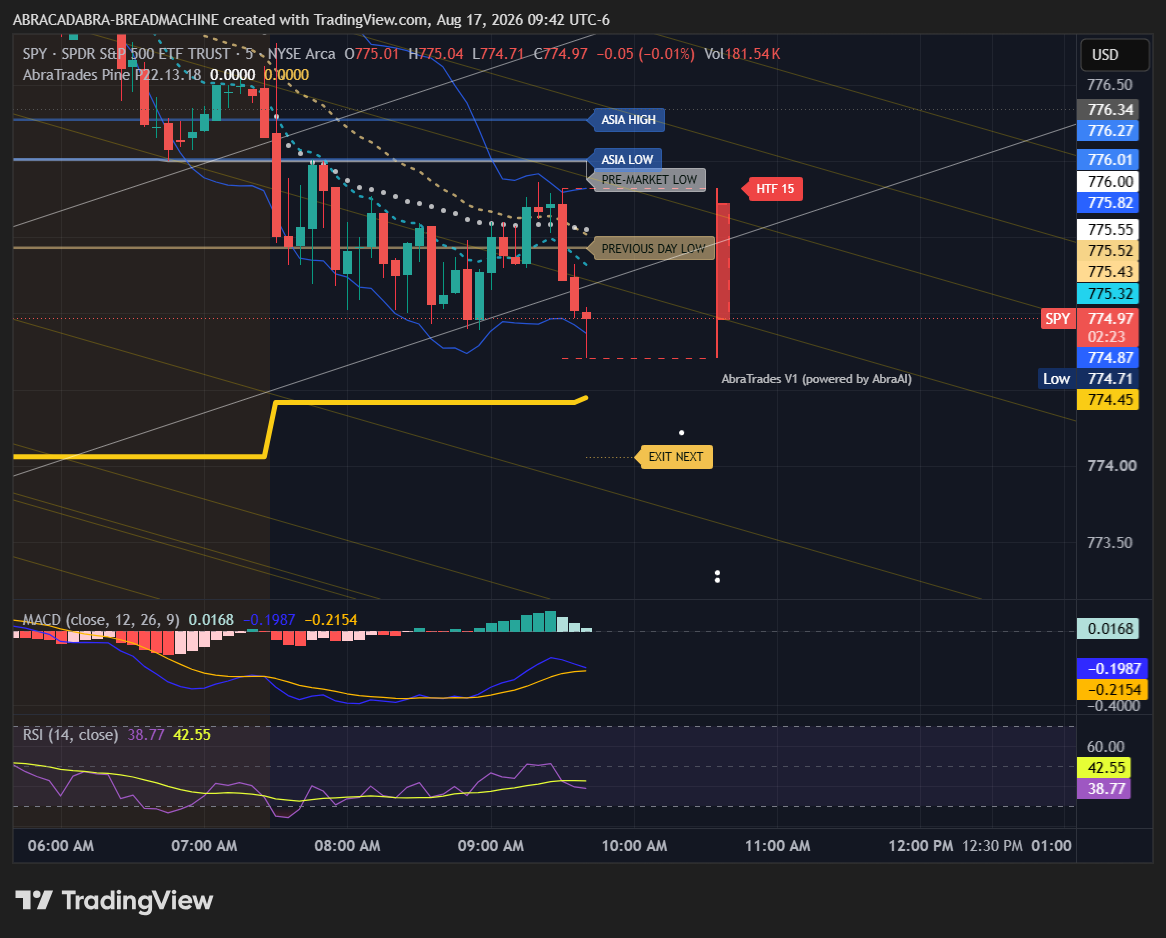
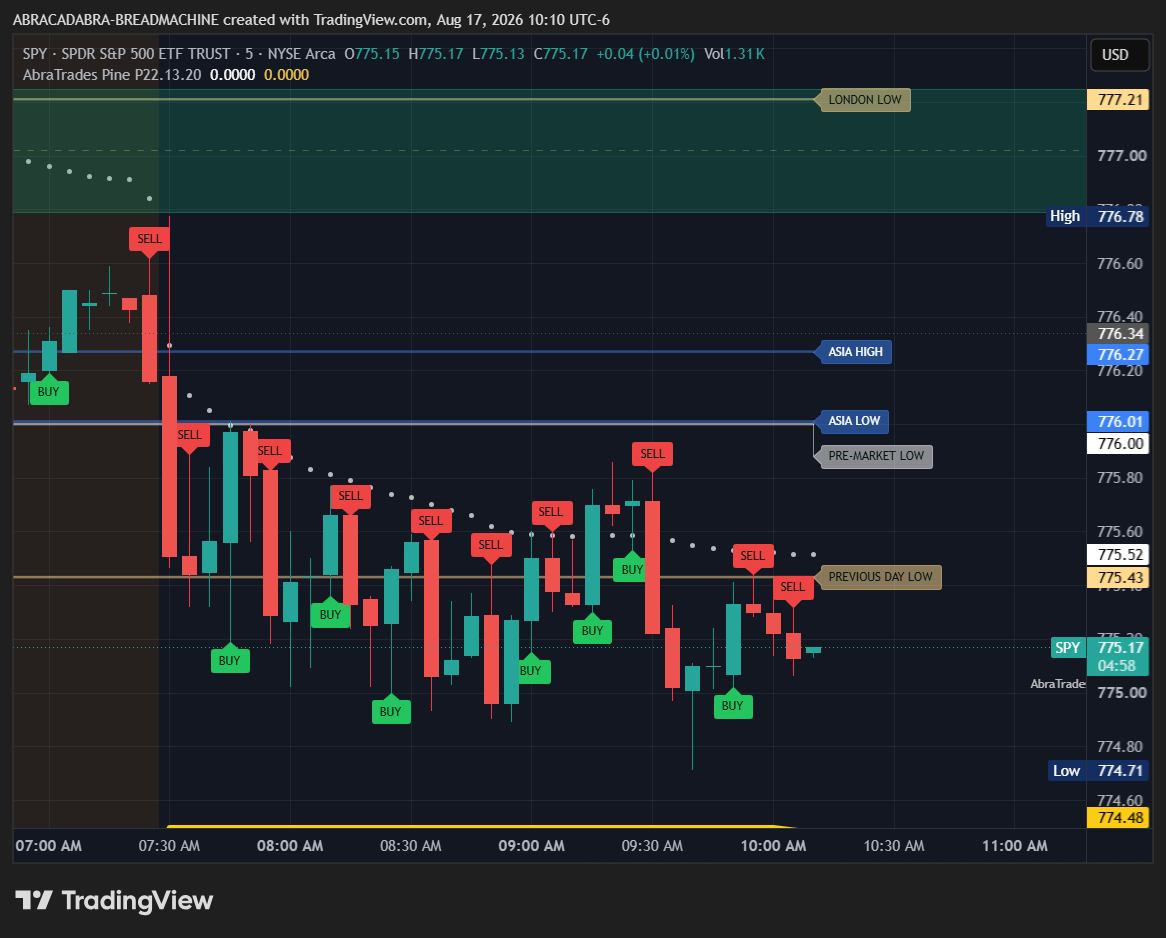
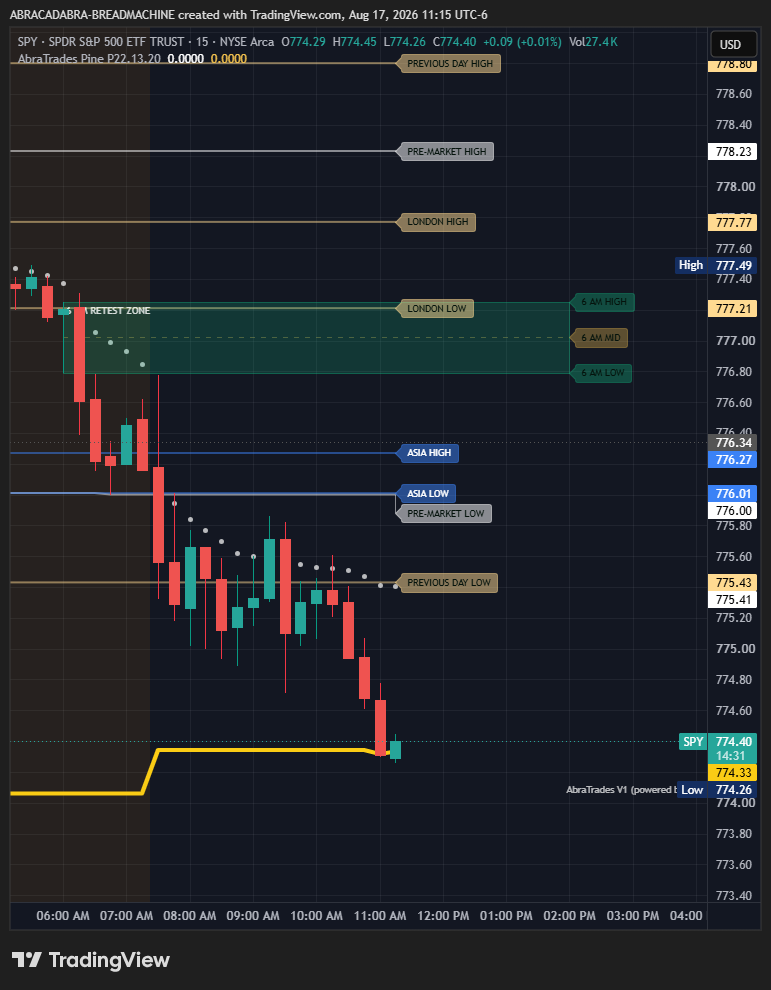
Watch the context build, one timestamp at a time.
The sequence begins with a pre-open test of the 8 AM retest zone. After the open, price tests the white dotted VWAP and moves through the Asia low, pre-market low, and previous-day-low areas. Those levels remain visible as reference points while the structure develops.
Later frames show repeated reactions around the displayed levels, theory-signal observations, and the yellow 5-day SMA that had already been identified as a lower reference. By 11:15 AM price was testing that line; the 11:29 AM frame records what happened next.
This is the core AbraTrades learning workflow: combine the built-in strategies in one configurable view, document an idea, compare price with visible liquidity and structure, study how those relationships change, and review the complete sequence afterward.
Educational use only: this historical chart study is an illustration, not trading advice, a recommendation, or a promise of future results.
See how AbraTrades is evaluated.
Review the signal framework, completed-candle rules, repainting limits, market assumptions, costs, slippage, latency, historical research, and the growing forward-testing archive. The record includes losses and limitations—not just favorable examples.
V1 is live. V2 is planned.
Two products, one agentic foundation — with a clear line between what is available today and the future V2 roadmap.
TradingView decision-support indicator
Available as Public Invite-Only. V1 visualizes market structure, levels, momentum, and confluence for chart study. It does not execute trades or connect to a broker; individual access is granted only after an explicit user request.
Future server-side system
In active development production, not released. V2 is a larger future system and is separate from V1. It has no announced release date, execution capability, or performance claim.
The Institutional Seven
The V2 roadmap contemplates additional server-side data inputs alongside a TradingView-style chart. It is not part of the V1 Pine indicator and is not available today.
Dark Pool Tracker
Dark Pool Agent
Tape Reader
Order Flow Agent
Crowd Gauge
Put/Call Ratio Agent
Newswire
News Sentiment Agent
Edgar Scout
SEC Filings / AI-pivot Agent
Value Auditor
P/E Ratio Auditor
Fortress Auditor
Fundamental Analysis Auditor
Follow the V2 roadmap.
V2 is a future concept for AbraHub.io and is not a current product, broker integration, or automated trading service. Any future offering would be described only after it is available and appropriately reviewed.
Educational use only: theoretical signals are not trading advice, are not recommendations to buy or sell, and do not guarantee profits or performance.
The think tank, visualized on your charts
Entry & exit areas
Identifies potential entry and exit areas when multiple market conditions align.
Setup confluence
Highlights setups demonstrating stronger multi-factor confluence for your own review.
Live in TradingView
It’s a Pine Script indicator — the agents’ data, visualized on your charts.
Lock in your rate — for good
Membership currently covers AbraTrades V1, the invite-only Pine script only. Your original rate is retained if you later cancel and reactivate with the same verified purchaser email. AbraTrades V2 is a separate planned system; it is not included with V1 access today.
Common questions
What is AbraTrades V1?
V1 is the Public Invite-Only AI-powered TradingView indicator and Pine Script available today. More than 30 specialized agents contribute educational chart context, levels, and theoretical signals. Access is granted only after an explicit user request.
Is AbraTrades a TradingView indicator?
Yes. AbraTrades V1 is an invite-only Pine Script indicator for TradingView charts. It visualizes market structure, liquidity, momentum, and confluence as educational chart context.
How do I get AbraTrades on TradingView?
Start checkout, provide the exact TradingView username for the account that should receive access, and follow the access instructions for the invite-only V1 indicator.
What happens if I cancel and return?
You may cancel anytime. If you later return, we will restore your original membership rate—including the $20 Founder rate—after verifying your original purchaser email. It is personal and cannot be transferred. If checkout does not restore it automatically, contact support before subscribing.
What is the refund policy?
Request a full refund—no questions asked—within 30 calendar days of your first paid subscription charge. After 30 days, prior payments are non-refundable, but you may cancel future billing at any time.
What is AbraTrades V2?
V2 is a future 100+ agent server-side roadmap. It is not included with V1 access and has no announced release date.
Is this financial advice?
No. AbraTrades and Abra AI are educational software tools, not financial advice. Trading involves substantial risk of loss, and past performance doesn’t guarantee future results.
Where can I review the methodology?
Read the AbraTrades TradingView indicator methodology and evidence archive for research boundaries, assumptions, limitations, and historical-study disclosures.
Lock in your founding price
Founding membership is $20/month for the first 100 members. Start secure checkout and enter your exact TradingView username so your invite-only access can be set up.